


On 1 September 2026 Spain’s national statistics institute (INE) published July’s arrivals and the headline was the record: 11.5 million international tourists in a single month, 4.6 % more than in July 2025. Underneath the headline sat a figure that got less attention and is more useful. Tourists whose main accommodation was a hotel grew 3.8 %; tourists whose main accommodation was a rented dwelling grew 12.0 %.
It is tempting to read that as a migration: guests leaving hotels for apartments. That is not what the data says. Hotels are still the main accommodation for two out of three international tourists, and they added more people in absolute terms than rental housing did. What changed is the pace, and pace is what matters when you decide which markets to target, what product to offer and how to organise arrivals.
This article explains what FRONTUR, the INE’s border survey, measures and what it does not, what July’s figures say about markets, destinations and spending, and how to turn them into acquisition, product and operational decisions for a hotel, an apartment manager or an owner with two properties.
What FRONTUR says about July 2026
FRONTUR (Estadística de Movimientos Turísticos en Fronteras, the INE’s monthly survey of non-resident arrivals) classifies every international tourist by their main accommodation. These are July’s figures with their year-on-year change:
| Tourists by main accommodation | July 2026 | Change |
|---|---|---|
| All international tourists | 11,538,796 | +4.6 % |
| Market accommodation | 9,731,487 | +4.0 % |
| Hotel | 7,648,753 | +3.8 % |
| Rental housing | 1,479,519 | +12.0 % |
| Other market accommodation | 603,215 | -8.8 % |
| Non-market accommodation | 1,807,308 | +8.0 % |
| Own property | 597,848 | +14.7 % |
| Home of family or friends | 1,034,334 | +3.2 % |
Two calculations of our own put the growth in proportion. Of all arrivals, hotels account for 66.3 % and rental housing for 12.8 %. And if you unwind the growth rates, hotels added roughly 280,000 tourists compared with July 2025, while rental housing added around 160,000. Apartments are growing three times faster; hotels are still adding more people.
June showed the same pattern: rental housing rose 10.1 % while hotels fell 1.7 %. Two consecutive months pointing the same way deserve attention. They are not yet a structural trend, and the INE will revise these figures in March 2027.
What FRONTUR measures and what it does not
Before drawing conclusions it helps to understand the unit of measurement, because most misreadings start here.
FRONTUR estimates each month how many non-resident visitors enter Spain. The unit is the entry, not the person: a German who comes in May and returns in July counts twice. Each trip is assigned to a single main accommodation, the place where the visitor spends most nights. Someone who spends three nights in a Madrid hotel and four in a Valencia apartment counts, for the whole trip, as rental housing.
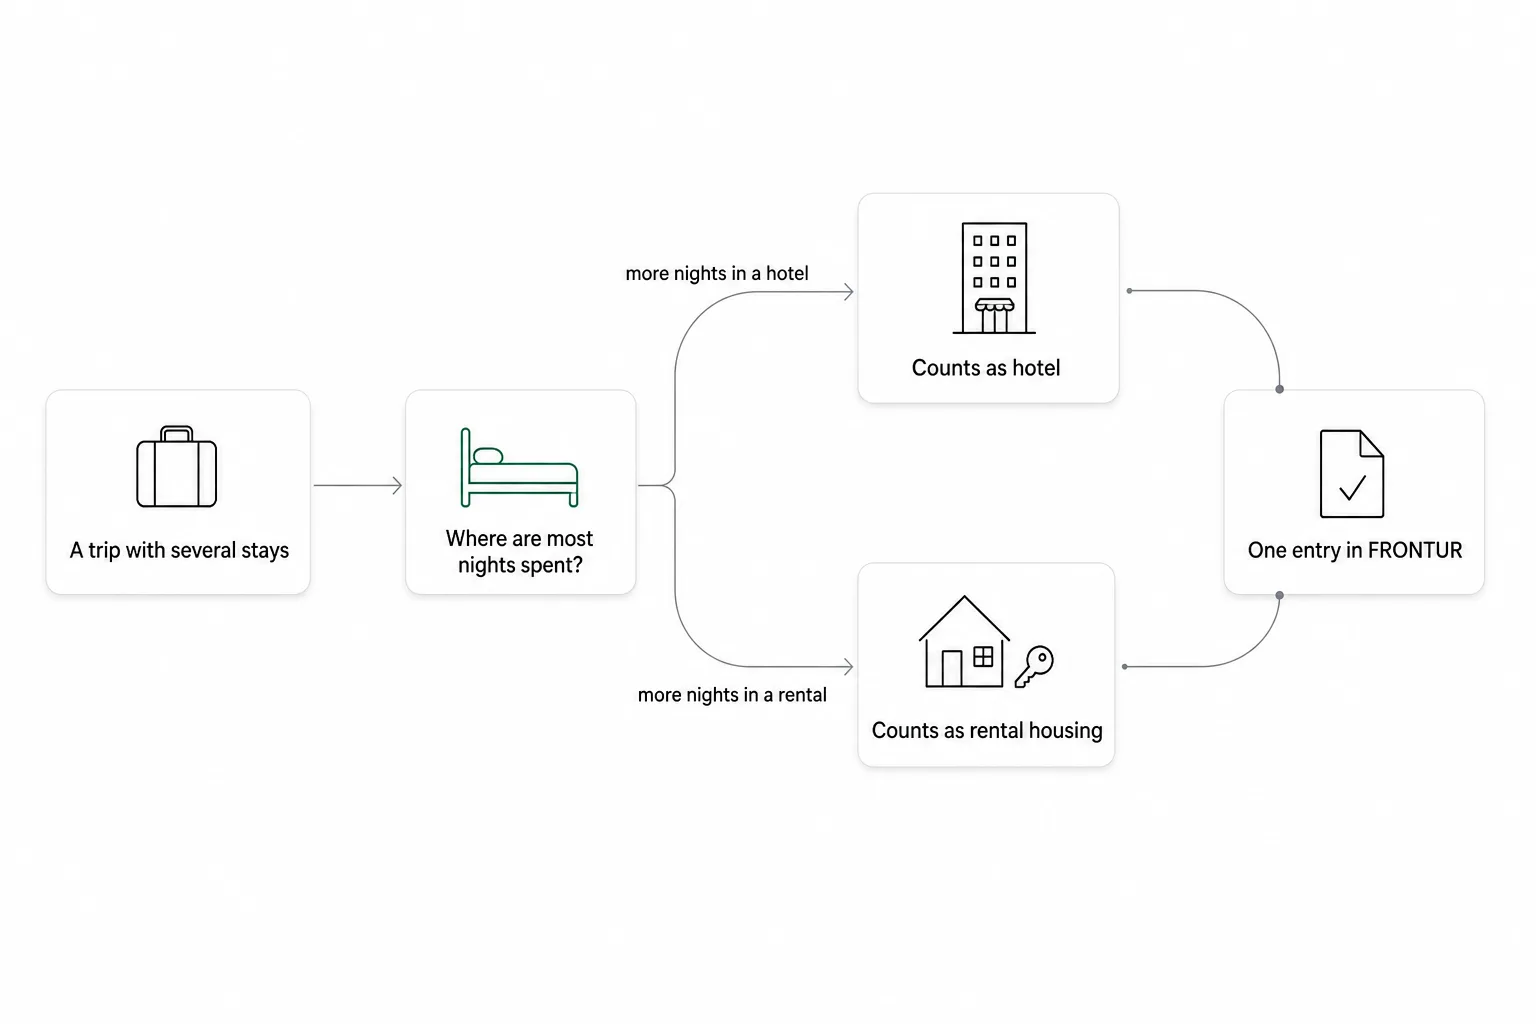
Three things follow that the statistic does not measure:
- Bookings. A tourist whose main accommodation is rental housing may have made one reservation or three.
- Nights or occupancy. FRONTUR does not count overnight stays. That is the job of the hotel survey (Coyuntura Turística Hotelera) and the non-hotel survey (Encuesta de Ocupación en Alojamientos Turísticos), which cover registered establishments and use different universes.
- Accommodation revenue. No ADR, no RevPAR, no turnover. Twelve percent more tourists in rental housing says nothing about what any apartment earned.
Comparing July’s other INE surveys shows why they cannot be mixed. The hotel survey recorded 44.8 million overnight stays, only 0.3 % more, with non-resident stays up 1.1 %. The non-hotel survey left overnight stays in registered tourist apartments unchanged, with non-resident stays down 2.2 % and the average stay 7.3 % shorter. In other words, more tourists chose a rented dwelling as their main accommodation, and at the same time registered apartments sold the same number of nights with shorter stays. Both are true because they measure different universes. If you run a hotel and want that month’s pricing read, it is in Spanish hotel prices 2026: ADR and RevPAR outrun demand.
Spending: more per trip, less per day
The tourist spending survey (EGATUR) completes the picture. In July international tourists spent €18,218 million, 10.9 % more, with an average of €1,579 per tourist (+5.9 %) and €218 per day (+3.7 %). The average stay was 7.2 days.
By item, accommodation was 19.8 % of total spending, around €3,610 million, up 6.7 %. That percentage mixes hotels, apartments, campsites and dwellings of every kind, and includes what was paid through packages and platforms. It is not any establishment’s revenue and cannot be compared with your average rate.
The most useful part of EGATUR for this topic is the breakdown by accommodation type:
| Main accommodation | Spend per tourist | Spend per day | Average stay |
|---|---|---|---|
| Hotel | €1,490 | €290 | 5.1 days |
| Other market accommodation | €2,056 | €192 | 10.7 days |
| Non-market | €1,405 | €116 | 12.1 days |
EGATUR groups rental housing under “other market accommodation” together with campsites, apartments and other paid lodging, so the row is not apartments alone. Even so, the profile is clear. The tourist who does not stay in a hotel stays twice as many nights, spends a third less per day and leaves more money per trip. It is a different customer: travelling as a family or a group, cooking now and then, wanting space and settling in. For a hotel, this is the guest drifting to another product; for an apartment manager, this is the guest who arrives and has to be looked after for ten nights.
Which markets and destinations are pushing
National rates hide differences you can actually use to decide who to target.
| Source market | Tourists July 2026 | Change | Spend per day | Average stay |
|---|---|---|---|---|
| United Kingdom | 2,187,700 | +5.6 % | €222 | 6.3 days |
| France | 1,587,673 | +2.3 % | €151 | 6.8 days |
| Germany | 1,209,462 | +2.3 % | €204 | 7.1 days |
| Netherlands | 790,925 | +6.2 % | n/a | n/a |
| Italy | 659,601 | +2.4 % | €196 | 8.8 days |
| Nordic countries | n/a | n/a | €175 | 6.7 days |
By destination, the Balearics (2.57 million, +0.1 %), Catalonia (2.37 million, +0.8 %) and the Canaries (1.22 million, -0.7 %) were flat. Growth came from Andalusia (1.69 million, +9.5 %), the Valencia region (1.63 million, +9.5 %), Madrid (0.80 million, +11.0 %) and the remaining regions (+11.8 %). In spending, Andalusia grew 23.4 % and the Nordic countries 24.5 %.
Two more figures help sharpen the product. Stays of four to seven nights remain the majority (5.7 million, +8.7 %) and stays of more than fifteen nights grew 12.8 %. Package trips grew 7.5 % against 3.7 % for independent travel, a reminder for anyone who had written off the tour operator.
A simple matrix for deciding who to target
The United Kingdom is the largest source market, and for that very reason the most expensive one to stand out in. Before launching a campaign by country, cross each market with what your property can genuinely deliver:
| Market | Typical lead time | Stay that fits | Channel where they find you | Language you need |
|---|---|---|---|---|
| United Kingdom | Long in summer, short for city | 4 to 7 nights | OTA and tour operator | English |
| Germany | Long | 7 nights or more | OTA, agency, own website | German and English |
| France | Short | 4 to 7 nights, by car | OTA and direct | French |
| Netherlands | Medium | 7 nights or more, families | OTA and rental platforms | English |
| Nordic countries | Long | 7 nights, winter | Tour operator and OTA | English |
The lead-time, stay and channel columns are industry rules of thumb, not INE data: replace them with what your own bookings from the last twelve months say. The rule is to pick the two markets where your minimum stay, your property type and your languages already fit, not the biggest market.
Turning the signal into product
The right reading of the data is neither “do what apartments do” nor “do what hotels do”. It is understanding what the growing tourist is looking for and seeing which part of that you can offer with your licence and your means.
If you run a hotel
- Rooms for more than two. Family rooms, connecting rooms or rooms with a basic kitchenette where the licence allows it. The ten-night guest who rents an apartment today is not after a buffet breakfast; they want space and not eating out every day.
- Four-to-seven-night packages. It is the fastest-growing stay length and the one that best absorbs a closed price with a minimum stay, without cutting the public rate.
- Modular services. Laundry, parking, breakfast and cleaning as separate extras, not a compulsory bundle. The long-stay tourist pays for what they use.
- Pre-arrival communication in their language. Confirmation, how to get there and what is included, before they land. A good booking confirmation email does most of this.
If you manage rental homes or apartments
- A clear booking with no surprises. Total price, deposit, times and house rules visible before payment. The foreign ten-night guest compares a lot and abandons at the first doubt.
- Arrival settled in advance. Self check-in or assisted, but decided: instructions, access and traveller registration completed before the guest arrives. The welcome letter and online check-in are the difference between a calm 23:00 arrival and a call in the small hours.
- Support in the guest’s language. You do not need to speak five languages; you need the answers to the ten most common questions to exist in them.
- Cleaning and capacity. A long family stay means verifying how many people actually sleep there and planning a mid-stay linen change.
- A calendar without gaps or double bookings. If you sell on several platforms, sync your calendars before opening new markets.
A dashboard that does not confuse spending with revenue
EGATUR tells you how much the tourist spends in the country, not how much you earn. To decide with your own data you need eight indicators, segmented by the guest’s country of residence:
- Demand by origin. Bookings and nights by country of residence, month by month.
- Direct conversion. Visits to your website or listing versus completed bookings, by language.
- Acquisition cost. OTA commission or campaign cost per booking, by market.
- Net ADR. Average rate after commissions and taxes, not the published rate.
- Average stay. Nights per booking; it is the metric that most separates hotels from rentals.
- Cancellation. Percentage of confirmed bookings, by channel and by lead time.
- Extras sold. Revenue per stay beyond the room: parking, late check-out, extra cleaning.
- Margin after operations. What is left after cleaning, laundry, reception and check-in per stay.
If you manage rental homes and have not yet worked out margin per stay, the formulas and a worked example are in how to calculate the profitability of your vacation rental. Indicators 5 and 8 decide whether a new market pays: a market with long stays and few arrivals can bring less gross revenue and more margin than one with many short bookings.
A 30-day experiment
You do not need to redesign your commercial strategy to use this data. You need a bounded test:
Week 1: pick two markets. One you already receive guests from (for a baseline) and one that is growing and fits your matrix. Note bookings, net ADR, average stay and cancellation for those two countries over the last twelve months.
Week 2: adapt the arrival. Translate the listing or landing page, the confirmation and the access instructions into the new market’s language. Review photos and description through that guest’s eyes: a Dutch family looks at the kitchen and the dishwasher; a British couple looks at the distance to the airport and the pool.
Week 3: create a measurable offer. A stay condition (seven nights with a discount, flexible arrival) or a closed package, available only to that market or language, so you can attribute results to it.
Week 4: tag and compare. Mark the origin and channel of every new booking in your PMS or channel manager. After thirty days compare conversion, net ADR, stay and margin against the baseline. If the new market brings more margin per stay, scale it; if it brings more bookings and less margin, do not.
The arrival is the part of the experiment most often neglected, and it is where a long-stay international guest decides whether to come back. Automating traveller registration and check-in with a check-in app frees the time that guest will ask you for at other moments.
Frequently asked questions
Are international tourists abandoning hotels?
Not according to FRONTUR. In July 2026 hotels were still the main accommodation for 66 % of international tourists and grew 3.8 %. Rental housing is growing faster (+12.0 %) from a much smaller base (12.8 % of the total). The data describes a change of pace, not a replacement.
Does “rental housing” in FRONTUR mean a licensed tourist rental?
No. It is any dwelling rented for the visitor’s temporary use, licensed or not, on a platform or not. The INE does not measure the legality of the accommodation.
Can I use the 19.8 % accommodation share to estimate my revenue?
No. It is the share of all international tourists’ total spending that went on accommodation of any kind, through any channel, packages included. It is not equivalent to the ADR, the RevPAR or the net revenue of any establishment.
Is one month enough to change commercial strategy?
No. July is a provisional figure and a year-on-year comparison. It is enough to pick two markets, adapt the arrival and measure for thirty days. The decision to scale is made with your own data, not the INE’s.
Does traveller registration change if the guest comes from outside the EU?
The duty to file the guest report with SES.Hospedajes (Spain’s police guest-registration platform) is the same for every guest, using the details of whatever document they present. What changes is arrival logistics: more guests landing late, with different documents and in another language. The more you settle before check-in, the better.