


Spanish hotels have now spent three months in a row earning more money without gaining many more guests. In August 2026 they charged 7.3 % more per occupied room. Nights sold rose only 1.4 %.
June and July showed the same picture. When we first published this analysis with the July data, we said one month was only a signal. Now there are three. Here is what the three months say together, what they do not say, and what to review this autumn.
Three months of data, June to August 2026
Every month Spain’s national statistics institute (INE) publishes its hotel survey. It is the official source for hotels in Spain. This table puts the last three months side by side. Each figure compares the month with the same month of 2025:
| Change vs 2025 | June | July | August |
|---|---|---|---|
| Nights sold | -0.9 % | +0.3 % | +1.4 % |
| Hotel price index | +5.6 % | +5.9 % | +6.3 % |
| ADR | +5.8 % | +6.8 % | +7.3 % |
| RevPAR | +4.9 % | +6.6 % | +7.0 % |
The reading is simple. Nights hardly move. Prices and revenue rise by between almost 5 % and just over 7 %, and each month a little more than the one before.
And these are the values for each month:
| Monthly value | June | July | August |
|---|---|---|---|
| Nights sold | 38.6 M | 44.8 M | 48.8 M |
| ADR | €137.1 | €156.9 | €166.9 |
| RevPAR | €101.6 | €119.3 | €133.1 |
| Bed occupancy rate | 65.6 % | 71.1 % | 76.1 % |
Do not compare these values across months. August always earns more than June because it is peak season. The first table is the one that tells you something: each month against the same month a year earlier.
ADR and RevPAR are not the same thing
The two metrics behind the headline measure different things:
- ADR (average daily rate): what you earn on average per occupied room. It measures the price you sell at.
- RevPAR (revenue per available room): what you earn on average per available room, sold or not. It is
ADR × room occupancy, so it combines price and fill rate in one number.
If you have 100 rooms, sell 70 at €150 and leave 30 empty, your ADR is €150 and your RevPAR is €105. The gap between the two is your unsold inventory.
In all three months RevPAR grew slightly less than ADR. Because RevPAR is ADR times room occupancy, that means room occupancy was a little below 2025 in June, July and August. The whole increase came from rate. In August room occupancy was 80.2 %, according to INE’s annex tables.
Do not mix it up with the 76.1 % in INE’s headline. That is bed-place occupancy, measured against beds on offer. It can rise while room occupancy does not, as long as each room sold holds more people.
If you manage apartments or holiday rentals and want the formulas with a worked annual example, they are in our holiday rental profitability guide. Here we stay with the market reading.
What changed in August
August brought a little more demand than July. Nights grew 1.4 % to more than 48.7 million. But price kept rising faster, so the gap between revenue and nights did not close.
That 1.4 % did not come equally from every guest:
- Nights by foreign travellers rose 2.8 %.
- Nights by travellers resident in Spain fell 1.1 %, the same as in July.
- From January to August, foreign travellers are up 2.0 % and residents only 0.4 %.
Be careful about reading this as a settled trend. June went the other way: residents rose 1.5 % and foreign travellers fell 2.0 %. What July and August do share is that the domestic guest added little in peak season. They are usually the most price-sensitive customer.
For your business, this means segmenting rather than raising every rate by the same amount. Check which market each booking comes from, which channel it arrives through and how far ahead it was made. A price a British guest accepts in July can empty your October weekends of Spanish guests.
Average stay fell, but do not jump to conclusions
Average length of stay in August was 3.43 nights, 1.51 % shorter than a year earlier. At the same time the number of travellers grew faster than nights (by about 2.9 %, going by the two official changes).
That does not prove each booking is shorter. INE counts travellers per establishment, not per booking, and a trip with two hotels counts twice. Look at your own bookings before you change your minimum stay.
Where the growth actually sits
The national average hides very different markets. By category, August looked like this:
| Category | ADR | RevPAR |
|---|---|---|
| Five star | €357.8 | €273.0 |
| Four star | €176.7 | €150.8 |
| Three star | €145.0 | €117.9 |
A five-star hotel earns much more per available room than a three-star charges per room sold. If you are thinking about moving up a category, read how hotel star ratings work in Spain first. That ADR does not come from adding a star to the façade.
By region, the differences are larger still:
- The Illes Balears had the highest bed occupancy, 90.3 %. Its ADR rose 9.2 % to €230.7. But its hotel nights did not grow: they came in slightly below August 2025. With hotels nearly full, only price can grow.
- Estepona, on the Costa del Sol, had the highest ADR and RevPAR in the country: €418.0 and €359.4.
- The price index rose 17.6 % in Ceuta and fell 3.3 % in the Madrid region.
These extremes are not a price target for your hotel. They describe one destination, one category and one month. The headline “Spanish hotels are raising prices” fits the Balearics or the Costa del Sol in August. It fits a three-star inland hotel much less well. Before touching your rate card, check whether you look like the average or like the exception.
What RevPAR is not telling you
RevPAR measures revenue, not profit. It can rise 7 % while your margin stands still or shrinks. INE’s data leaves out OTA commissions, staff, utilities, cleaning and what each guest costs you to win. So nobody can say hotel margins rose 7 %.
There are three reasons to stay cautious:
Costs went up too. Exceltur’s destination profitability barometer for the first four months of 2026 attributes the revenue improvement mainly to better rates (+3.8 %), with a marginal contribution from occupancy (+0.2 %). It links that partly to hotels passing on higher costs. Earning more to cover more is not making more.
The national average hides the losers. In the same barometer, of the 102 destinations analysed, 63 improved on 2025 and 39 fell below it. Urban RevPAR grew 5.9 % over the four months. Holiday destinations managed 0.1 %.
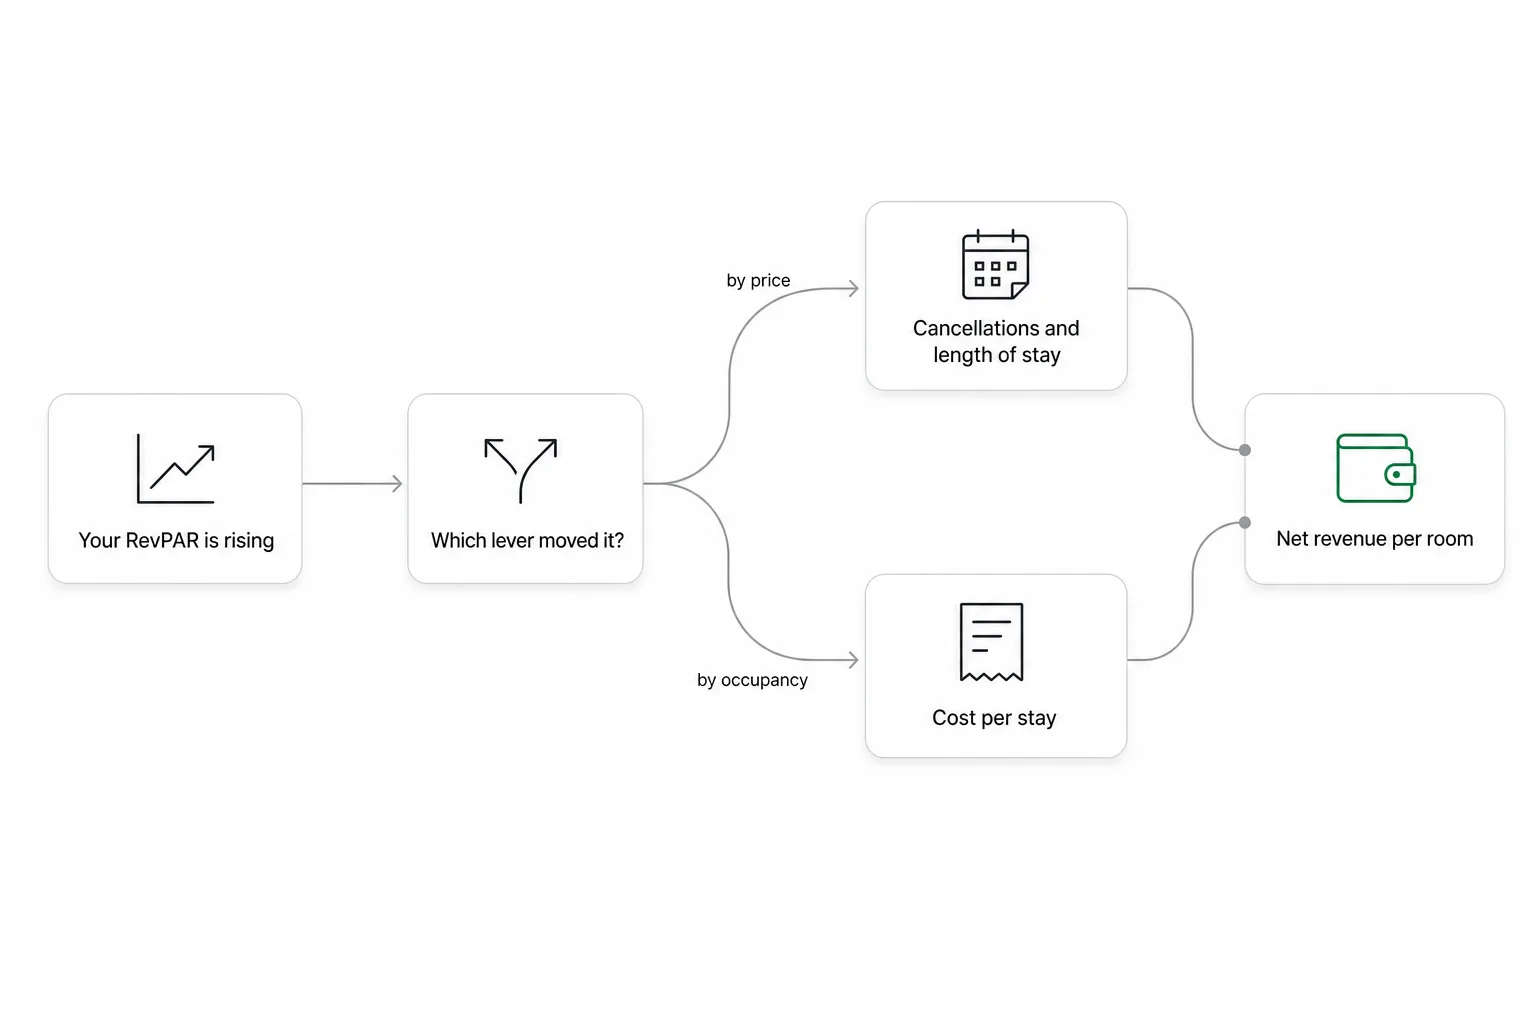
RevPAR does not see what happens after the booking. It does not capture cancellations, cleaning cost per stay, extras or reputation. A higher ADR with more cancellations and shorter stays can leave you worse off than last year.
Four indicators to watch if you have raised rates
When growth comes from price, problems usually show up here first:
- Cancellation rate. A high rate booked far ahead with free cancellation is the easiest one to drop if the guest finds something better. Measure cancellations against confirmed bookings, by channel and by rate plan.
- Length of stay. If price goes up and nights per booking go down, you earn about the same and work harder: more arrivals, more departures, more cleans.
- Reputation. A higher price raises what the guest expects. Watch your average score and comments about value for money. To ask for reviews more successfully, here are the keys to getting reviews on Booking.
- Channel mix. Growing on price through high-commission OTAs with free cancellation is not the same business as growing on direct bookings, even at the same ADR.
An autumn revenue management plan
You do not need an expensive system to run a price-led season well. You need order. Four weeks:
Week 1: measure your baseline. Work out ADR, occupancy, RevPAR, cancellations, length of stay and cost per stay for the last twelve months. Compare each month with the same month of 2025, not with the month before.
Week 2: segment. Repeat those figures by channel, country of origin, booking lead time and length of stay. There is almost always one segment that lifts ADR and sinks margin. And a small, quiet one that actually pays for the season.
Week 3: set an alarm to cut in time. Decide in advance when you will correct your rate. For example: when bookings for a month are coming in slower than in 2025, or when your website conversion drops. Act on it even if the national average keeps rising. The average does not fill your rooms.
Week 4: adjust restrictions before prices, and prepare the low season. Minimum stay, arrival days and cancellation windows move margin without touching your public rate. If summer no longer grows in volume, growth has to come from the weak months. The tactics are in our guide on beating tourism seasonality.
One rule runs through the whole plan: every euro you add shows up in operations. A guest who paid €180 tolerates a chaotic arrival far worse than one who paid €90. With high prices, automating online check-in and tidying up your check-out is a revenue decision as much as an operational one.
Frequently asked questions
Do three months in a row mean the cycle has changed?
They confirm that summer 2026 grew mostly on price. They do not prove the pattern is permanent or that it applies to every hotel. September, outside peak season, and the full-year figures will show whether it continues.
Does +7.3 % ADR mean I can raise my rate 7.3 %?
No. It is a national average that blends five-star Costa del Sol hotels with three-star inland ones. Your room to raise prices is set by your direct competitors, your category, your source markets and your service, not by the country’s average.
Is it better to raise ADR or occupancy?
It depends on your costs. If each stay costs you a lot (cleaning, amenities, staff per arrival), an extra night leaves little margin and price usually wins. If it costs you little and you have empty rooms, occupancy wins.
Why does the price index rise less than ADR?
They measure different things. INE’s hotel price index follows rates on a like-for-like basis. ADR is what was actually billed per occupied room. If more expensive rooms sell, ADR rises even when no rate has changed. Do not compare the hotel price index with consumer inflation either: they measure different baskets.
Do these figures apply to tourist apartments and holiday rentals?
Only as context. This survey covers hotels and guesthouses. Registered tourist apartments are in a separate INE survey, and unregistered holiday rentals appear in neither.
Details and sources
Implied room occupancy. INE publishes room occupancy only in its annex tables. Its change can be worked out from the other two: (1 + RevPAR change) / (1 + ADR change) - 1. With the rounded rates it comes to roughly -0.9 % in June, -0.2 % in July and -0.3 % in August. This is an estimate from provisional data, not an official figure.
Travellers in August. Average stay is nights divided by travellers. If nights rise 1.38 % and average stay falls 1.51 %, travellers rise by about 2.9 %.
Balearics. INE’s press release does not give the change in nights by region. We compared it with the August 2025 annex: about 11.37 million nights in 2026 against about 11.39 million in 2025. The 2025 annex figure was provisional, so the exact change may differ slightly.
Revisions. With the August 2026 release, INE updated its August 2025 price index and profitability indicators. The changes in this article are the ones INE published on 22 September 2026.
Sources (in Spanish):